Learn how to read an HPLC chromatogram, understand retention time, peak area, peak height, baseline, and common peak problems in a simple beginner-friendly way.
An HPLC chromatogram is more than a graph with peaks.
For a beginner, it may look like a simple line on a screen. But for an analyst, the chromatogram contains important information about separation, retention, peak shape, method performance, and possible problems inside the system.
A good chromatogram can help answer practical questions such as:
- Did the compound appear at the expected time?
- Is the peak shape acceptable?
- Is the baseline stable?
- Are there extra peaks?
- Is the response suitable for quantitation?
- Could there be a problem with the method, sample, column, or system?
This article explains how to read an HPLC chromatogram step by step in a simple and practical way for beginners, students, fresh graduates, and junior laboratory analysts.
What Is an HPLC Chromatogram?
An HPLC chromatogram is the graphical output produced during an HPLC analysis.
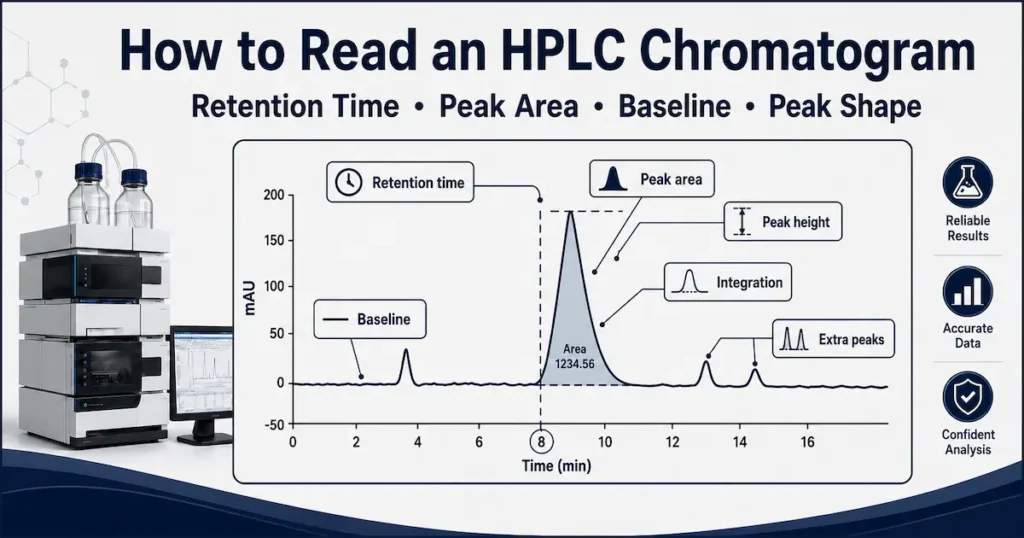
It usually shows detector response on the vertical axis and time on the horizontal axis.
In most UV or PDA methods:
- The x-axis represents time, usually in minutes.
- The y-axis represents detector response, such as absorbance.
- Each peak may represent a compound reaching the detector.
- The position, size, and shape of the peak provide analytical information.
In simple terms, the chromatogram shows what came out of the column and when it came out.
Why Reading the Chromatogram Matters
Reading the chromatogram correctly is one of the most important practical skills in HPLC.
A chromatogram can help the analyst evaluate:
- Whether the analyte is present.
- Whether the analyte appears at the correct retention time.
- Whether the peak is suitable for integration.
- Whether the separation is acceptable.
- Whether there are impurities or extra peaks.
- Whether the baseline is stable.
- Whether the method may have a problem.
- Whether the results are reliable enough to continue.
Many beginner mistakes happen because the analyst looks only at the peak area or final result and ignores the overall chromatogram.
A result may look acceptable numerically, but the chromatogram may show warning signs such as poor peak shape, unstable baseline, extra peaks, or integration errors.
The Main Parts of an HPLC Chromatogram
A basic HPLC chromatogram contains several important parts.
The most important ones are:
- Baseline.
- Peaks.
- Retention time.
- Peak area.
- Peak height.
- Peak width.
- Integration marks.
- Noise and drift.
- Extra or unknown peaks.
Understanding these elements helps the analyst interpret the chromatogram more confidently.
1. Baseline
The baseline is the signal level when no major compound is passing through the detector.
Ideally, the baseline should be reasonably stable and smooth.
A stable baseline helps the software integrate peaks correctly and allows the analyst to detect small peaks more easily.
Common Baseline Problems
Baseline problems may include:
- Noise.
- Drift.
- Sudden jumps.
- Waves.
- Spikes.
- Unstable signal.
These problems may be related to:
- Mobile phase quality.
- Poor degassing.
- Detector issues.
- Temperature changes.
- Contaminated solvents.
- Air bubbles.
- Column equilibration.
- Gradient method conditions.
A poor baseline can make peak integration difficult and may affect quantitative results.
2. Peaks
A peak appears when a compound elutes from the HPLC column and reaches the detector.
In a good chromatogram, the main analyte peak should usually be clear, well-shaped, and separated from nearby peaks.
A peak can provide several types of information:
- Its position tells when the compound eluted.
- Its area is often used for quantitation.
- Its height reflects detector response.
- Its shape may indicate method or system problems.
- Its separation from other peaks affects result reliability.
Not every peak should be treated as the target analyte. The analyst must compare the chromatogram with standards, blanks, system suitability injections, and method requirements.
3. Retention Time
Retention time is the time at which a compound appears in the chromatogram.
It is usually measured from the start of injection to the peak maximum.
For example, if the main peak appears at 5.20 minutes, the retention time is approximately 5.20 minutes.
Retention time helps identify whether a peak is likely to be the expected compound.
Why Retention Time May Shift
Retention time can change because of:
- Mobile phase composition changes.
- Flow rate problems.
- Column temperature changes.
- Column aging.
- Incorrect method settings.
- Poor column equilibration.
- Different column chemistry.
- Pump mixing problems.
- Air bubbles or pressure instability.
A small change may be acceptable depending on the method, but a large or unexplained shift should be investigated.
4. Peak Area
Peak area is the total area under the peak.
In many HPLC assays, peak area is used for quantitative calculation because it is related to the amount of analyte reaching the detector.
A larger peak area usually means a higher analyte response, assuming the method conditions are correct.
Peak area is commonly used in:
- Assay determination.
- Impurity testing.
- Calibration curves.
- Content uniformity.
- Dissolution testing.
However, peak area is only useful when the peak is integrated correctly and the chromatogram is suitable.
A wrong baseline, poor peak shape, or incorrect integration can produce misleading peak areas.
5. Peak Height
Peak height is the vertical distance from the baseline to the top of the peak.
Peak height may be useful in some methods, but peak area is more commonly used for quantitative HPLC work.
Peak height may change if the peak becomes broader, even when the total amount of analyte is similar.
For example, a broad peak may have a lower height but still have a significant area.
This is why analysts should not judge concentration only by looking at peak height visually.
6. Peak Shape
Peak shape is one of the first things an analyst should check.
A good peak is usually narrow, symmetrical, and well separated from other peaks.
Common peak shape problems include:
- Tailing.
- Fronting.
- Broadening.
- Splitting.
- Shoulder peaks.
- Negative peaks.
- Very small or distorted peaks.
Peak shape problems may indicate issues with:
- Column condition.
- Mobile phase pH.
- Sample solvent.
- Injection volume.
- Column overload.
- Poor fittings.
- Dead volume.
- Interaction with active sites.
- Method conditions.
Peak shape should always be interpreted together with method history, system suitability, and recent changes.
7. Peak Width
Peak width describes how broad or narrow the peak is.
Narrow peaks usually indicate efficient separation and lower band broadening.
Broad peaks may reduce sensitivity and resolution.
Peak broadening may be caused by:
- Column aging.
- Incorrect tubing dimensions.
- Extra-column volume.
- Poor column efficiency.
- Slow detector response.
- Strong sample solvent effect.
- Poor method conditions.
- Incorrect flow rate.
A broad peak may still be integrated, but it can affect separation, sensitivity, and reproducibility.
8. Integration Marks
Integration is the process by which the software defines the start and end of a peak and calculates the area.
The analyst should always check the integration marks, not only the final numbers.
Integration problems may include:
- Peak start selected too early.
- Peak end selected too late.
- Baseline drawn incorrectly.
- Two peaks integrated as one.
- One peak split into two.
- Small impurity peak missed.
- Noise integrated as a peak.
- Shoulder peak ignored.
Incorrect integration can directly affect assay and impurity results.
In regulated laboratories, manual integration must follow approved procedures and must be justified, documented, and traceable.
9. Extra Peaks
Extra peaks are peaks that appear in addition to the expected main analyte peak.
They may come from:
- Impurities.
- Degradation products.
- Solvent contamination.
- Mobile phase contamination.
- Carryover.
- Sample matrix.
- Blank contamination.
- Column bleed.
- Previous injections.
- Incorrect washing.
Extra peaks should not be ignored, especially in impurity or related substances methods.
The analyst should compare:
- Blank chromatogram.
- Standard chromatogram.
- Sample chromatogram.
- System suitability chromatogram.
- Previous accepted runs.
This comparison helps identify whether the peak belongs to the sample, the method, or the system.
10. Noise and Drift
Noise refers to small random fluctuations in the baseline.
Drift refers to a gradual movement of the baseline upward or downward.
Both can affect the reliability of small peak detection.
Possible causes include:
- Poor mobile phase quality.
- Air bubbles.
- Detector lamp problems.
- Temperature instability.
- Poor equilibration.
- Gradient effects.
- Contaminated flow cell.
- Solvent mismatch.
- Inadequate degassing.
Noise and drift are especially important in impurity methods, where small peaks may be close to the detection limit.
How to Read a Chromatogram Step by Step
A beginner should avoid looking only at the final result.
A better approach is to read the chromatogram systematically.
Step 1: Check the Baseline
Start by looking at the baseline.
Ask:
- Is it stable?
- Is there excessive noise?
- Is there drift?
- Are there spikes or sudden jumps?
- Was the system equilibrated properly?
If the baseline is poor, peak integration and small peak detection may be affected.
Step 2: Find the Main Peak
Identify the main analyte peak by comparing it with the standard or reference chromatogram.
Check:
- Does it appear at the expected retention time?
- Is the peak clear?
- Is the peak separated from nearby peaks?
- Does it match the expected method behavior?
Do not identify a peak only because it is the largest peak.
Step 3: Check Retention Time
Compare the retention time with previous runs or system suitability expectations.
A retention time shift may indicate a change in method conditions, mobile phase, flow rate, column temperature, or column condition.
Step 4: Check Peak Shape
Look carefully at the peak shape.
Ask:
- Is the peak symmetrical?
- Is there tailing?
- Is there fronting?
- Is there a shoulder?
- Is the peak broader than usual?
- Is the peak split?
Poor peak shape may affect both identification and quantitation.
Step 5: Check Separation
Look at nearby peaks.
Ask:
- Is the main peak separated from impurities?
- Are any peaks overlapping?
- Is there a shoulder peak?
- Is the resolution acceptable?
If peaks are not separated, the result may not be reliable.
Step 6: Check Integration
Review the integration marks.
Ask:
- Did the software select the correct start and end?
- Was the baseline drawn correctly?
- Were nearby peaks integrated separately?
- Was noise incorrectly integrated?
- Was a small peak missed?
A correct chromatogram can still produce a wrong result if integration is incorrect.
Step 7: Compare with Blank and Standard
Comparison is essential.
The analyst should compare the sample chromatogram with:
- Blank.
- Standard.
- System suitability.
- Previous sample injections.
- Previous accepted sequence.
This helps distinguish real sample peaks from contamination, carryover, or system peaks.
Practical Chromatogram Reading Table
| Chromatogram Observation | Possible Meaning | First Checks |
|---|---|---|
| Main peak at expected time | Analyte likely detected | Compare with standard and method criteria |
| Retention time shifted | Method or system condition changed | Check mobile phase, flow rate, temperature, column |
| Peak tailing | Secondary interaction or column issue | Check pH, column condition, sample solvent |
| Peak fronting | Overload or solvent effect | Check concentration, injection volume, sample solvent |
| Broad peak | Loss of efficiency or extra-column volume | Check column, tubing, flow rate, fittings |
| Split peak | Injection or column problem | Check sample solvent, injector, column inlet |
| Extra peaks | Impurity, contamination, carryover | Compare blank, standard, and sample |
| No peak | Injection, detector, method, or sample issue | Check vial, injection, wavelength, standard |
| Noisy baseline | Solvent, detector, air, or contamination | Degas, check mobile phase and detector |
| Baseline drift | Equilibration or gradient issue | Check mobile phase, temperature, method conditions |
Common Beginner Mistakes When Reading Chromatograms
Avoid these common mistakes:
- Looking only at the final calculated result.
- Assuming the largest peak is always the analyte.
- Ignoring baseline problems.
- Ignoring retention time shifts.
- Accepting poor peak shape without investigation.
- Ignoring extra peaks.
- Trusting automatic integration without review.
- Comparing sample chromatograms without checking the blank.
- Changing integration manually without justification.
- Continuing analysis when system suitability has failed.
- Ignoring small changes from previous runs.
- Not documenting observations.
A chromatogram should always be interpreted as part of the full analytical context, not as an isolated graph.
Chromatogram Reading in Assay Methods
In assay methods, the main focus is usually the analyte peak area.
However, the analyst should still check:
- Retention time.
- Peak shape.
- Baseline stability.
- Integration.
- Standard response.
- Sample response.
- System suitability.
- Repeatability.
A good assay result requires both a correct calculation and a chromatogram suitable for quantitation.
Chromatogram Reading in Impurity Methods
In impurity or related substances methods, chromatogram reading becomes more sensitive.
The analyst should pay attention to:
- Small peaks.
- Unknown peaks.
- Peak separation.
- Baseline noise.
- Integration threshold.
- Blank interference.
- Carryover.
- Degradation peaks.
- Resolution between critical peaks.
Small peaks may be important, especially when they are near reporting thresholds or specification limits.
When Should a Chromatogram Be Investigated?
A chromatogram should be investigated when:
- The main peak is missing.
- Retention time shifts significantly.
- Peak shape becomes poor.
- Extra unexpected peaks appear.
- Baseline becomes unstable.
- Peak area changes unexpectedly.
- Integration is incorrect.
- Resolution becomes poor.
- System suitability fails.
- The chromatogram looks different from the normal method pattern.
A chromatogram that looks abnormal should not be accepted only because the final number appears acceptable.
Final Takeaway
An HPLC chromatogram is not just a graph.
It is a practical diagnostic tool that helps the analyst understand what happened during the analysis.
A beginner should learn to check:
- Baseline.
- Retention time.
- Peak shape.
- Peak area.
- Peak height.
- Integration.
- Extra peaks.
- Noise and drift.
- Comparison with blank and standard.
The best approach is to read the chromatogram step by step, compare it with the expected method behavior, and avoid making conclusions from one number only.
A good analyst does not only ask:
“What is the result?”
A good analyst also asks:
“Does the chromatogram support this result?”
New to HPLC? Start with the Free Starter Kit
Download a practical beginner-friendly PDF guide to help you understand common HPLC problems and what to check first.

Ready to Go Beyond the Basics?
Continue your learning with the complete 17-part HPLC Practical Guide series designed for beginners, junior analysts, fresh graduates, and QC laboratory starters. Build practical confidence in HPLC fundamentals, system components, troubleshooting, QC readiness, and realistic laboratory cases.